Filtering chart data
1. Tap the bottom menu button to open the fasting menu options.
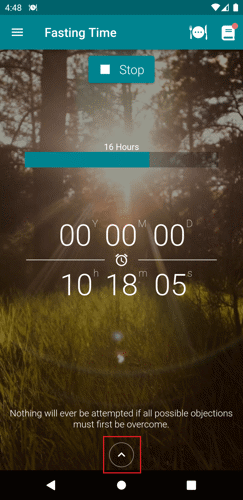
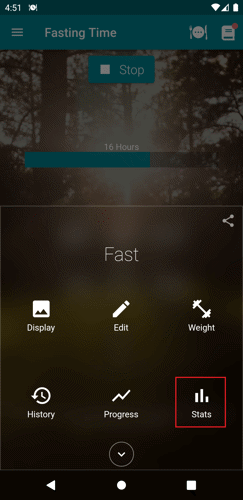
2. Tap the Stats button.
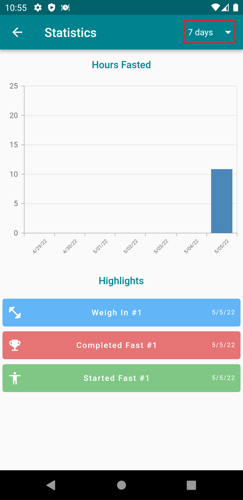
3. On the top-right corner of the page, tap the dropdown filter button.
4. Choose the preferred filter. You can also put a custom range.
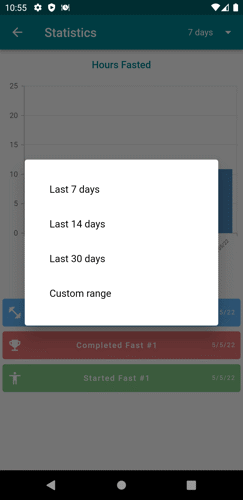
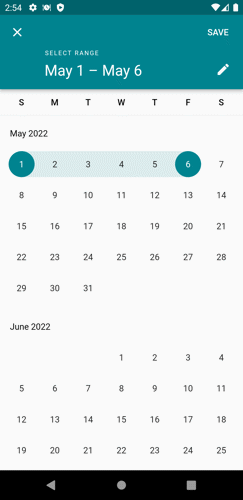
5. For the custom range choose a start and end date. Tap Save.
6. On the Stats page, you will see the data from the range selected. Slide the chart horizontally to check more data. You can also tap the bar to see its designated data.